

There’s been a lot of chat lately about the eighteen-year real estate clock. 
So much so, that it appears to be turning into an accepted truth about housing market performance.
But is there really an eighteen-year clock?
The promoters of the eighteen-year cycle claim that Western economies exhibit an 18-year real estate cycle which averages out as 14 years up and 4 years down.
This is eagerly accepted by Australian property investors because if the cycle exists, it means that housing markets won’t crash until fourteen years or more so have passed since the last crash during the Global Financial Crisis.
So, the cycle predicts that they will keep rising in price until at least 2022.
The proponents of this theory have studied the US housing market and according to their research, the Australian market closely follows the US. 
There is no doubt that USA housing markets as well as those in much of the Western World crashed in 2008-2010 in what has become known as the Global Financial Crisis.
Eighteen years before that we had the “recession we had to have” in 1990 so there’s the eighteen-year clock in action, they claim.
This is a classic case of believing what we want to believe, not what the facts tell us.
The theory is actually a myth, because housing prices in Australia did not crash around 1990 or 2008.
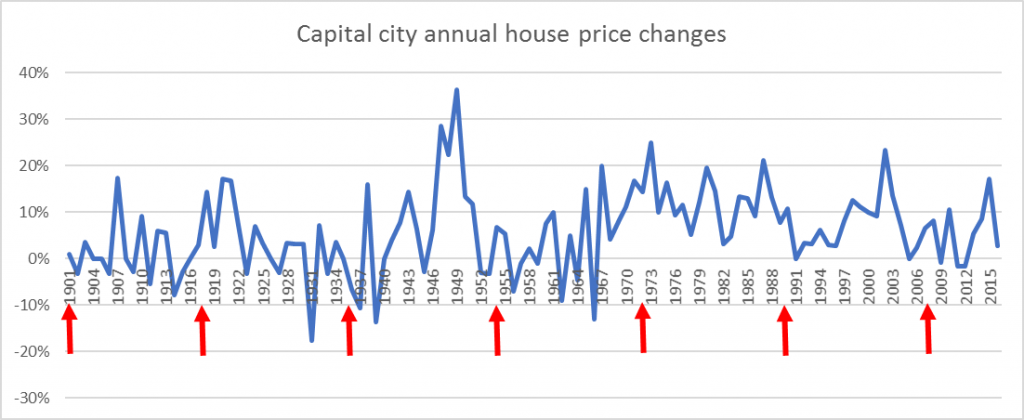
The graph below shows the aggregated Australian capital city annual house price changes since 1901[1] and the red arrows indicate the eighteen year intervals going back from the GFC when, according to the theory, each four-year period of price falls was supposed to have occurred.
[1] Australian aggregate capital city annual house price changes are derived from the following sources: Australian National Library’s on-line Trove facility
Mitchell Library archives. House Price Indexes, Eight Capital Cities, 6416.0 Australian Bureau of Statistics. Housing Australia a Statistical Review, 1991, 1996 Australian Bureau of Statistics
Stapledon’s Index (Stapledon, Nigel, Long Term Housing Prices in Australia, University of NSW. Mastering the Australian Housing Market, John Lindeman, Wileys 2011
The graph shows that there has only been one period when around fourteen years of price rises were followed by four years of price falls in our entire history as a nation – which w as during the postwar 1940s and 1950s.
The fact that the eighteen year real estate myth persists is proof that “what we learn from history is that people don’t learn from history.”
Furthermore, the picture is more complex than the graph suggests, because one city may be booming while another is correcting, such as we see now where Darwin and Perth are falling in price, Adelaide and Brisbane have had low growth while Melbourne and Sydney have been booming for several years.
Our housing markets dance to different tunes from overseas markets – in some years economic recessions, financial crises and wars in other parts of the world encourage huge numbers of people to emigrate to our largest cities so that our market booms when those overseas are crashing.
At other times, we may have mining expansions, infrastructure projects or drought recovery which leads to housing market booms not related in any way to the performance of overseas housing markets.
Our nation is huge and diverse and there is nearly always a housing market boom occurring, or about to take place somewhere.
The graph also shows that periods of actual price falls in our capital cities are rare occurrences.
In the last fifty years, there have only been three years when prices fell slightly, and then they immediately recovered.
It’s because continued population growth in our major capital cities causes a rising demand for housing which leads to a more or less constant shortage of supply. 
This translates into price rises when housing finance is easy to obtain and cheap, or rent rises when housing finance is harder to obtain or interest rates are high.
It is the constantly changing relationship between these three housing demand dynamics which determines where and when housing prices or rents are likely to rise or fall.
Uninformed generalisations such as the eighteen-year real estate clock may offer hope to those who might otherwise expect an imminent crash in Sydney or Melbourne’s housing market.
But, this hope is false, because the eighteen year real estate clock does not work in Australia.
Read more: propertyupdate.com.au