
The media has been having a field day with negative property news.
In particular this week’s figures by the Domain Group which showed that all but three capital cities saw a decrease in median house price over the last three months.
 But let’s put things into perspective…the national median house price also fell by 1.0 per cent – now that’s not a property crash.
However in a recent ANZ research report to its institutional and professional clients, economist Daniel Gradwell explained that the housing market weakness is not limited to house prices, rentals are also soft.
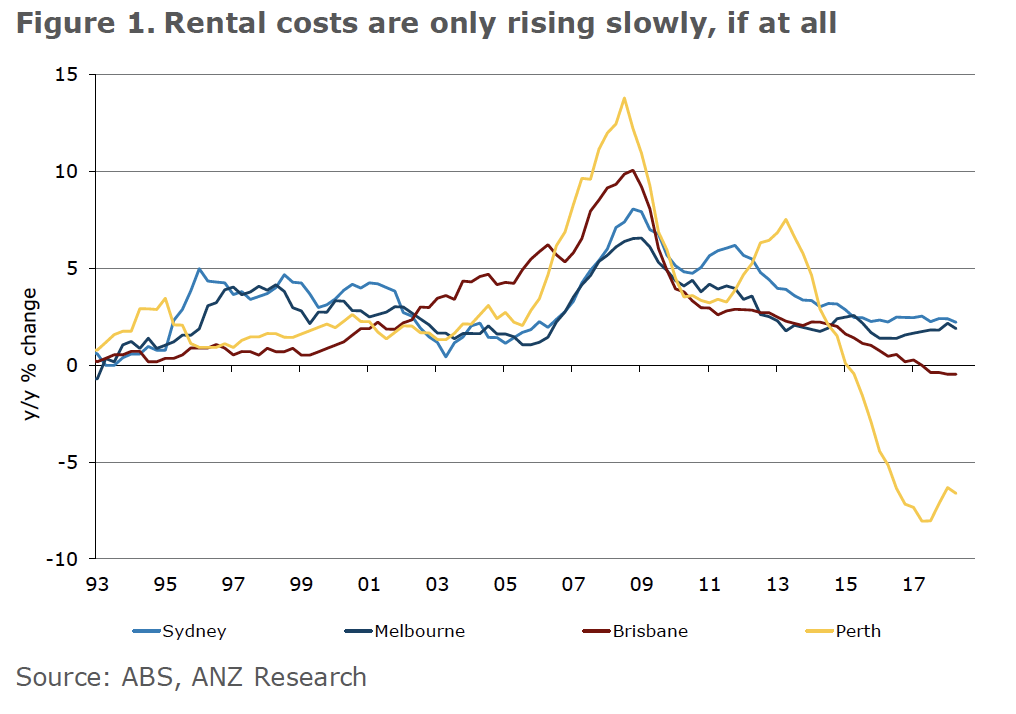
According to ANZ rents at the national level were flat in the last 3 months – the weakest quarterly result in over two decades.
Other key findings:
Wages growth remains soft, but is still rising faster than rental costs through much of the country. As a result, rental affordability has been improving, especially in Sydney, Perth and Darwin. However, Hobart’s rental cost affordability has been worsening, similar to the rapid housing price growth in recent years.
Housing affordability has been improving as the current correction in prices plays out. It is important to keep in mind that rental affordability is part of that story as well, given that a material share of Australian households are renters. Perhaps this helps explain why consumer confidence has been holding up well despite the drop in housing prices and homeowner’s equity.
Here is ANZ’s heat map of the factors affecting our property markets…

Here are some further comments from ANZ’s reprot..
RENTAL COSTS WEIGH ON CPI, IMPROVE HOUSING AFFORDABILITY
The weakness in Australia’s housing market has been well documented in recent months, especially as prices continue to fall across Sydney and Melbourne.
Indeed, we expect Core Logic monthly housing prices numbers (due on Wednesday 1 August) to show a fall of around 0.5% m/m for July, with the decline again led by the eastern seaboard. But it’s becoming increasingly apparent that it’s not just prices that are weak – the rental market is also seeing softness. 
Australia’s Q2 CPI data showed that nationwide, rental costs were flat in the quarter, which is the weakest quarterly result since March 1994.
And in annual terms, rents are only 0.6% higher than a year ago.
This makes it one of the few non-discretionary spending items for which the price is rising slower than income growth.
Similar to the story on housing prices, it is important to keep in mind the differences in rental costs across the states.
Rents are still rising in Sydney and Melbourne, but the rate is decelerating and the increase in Q2 was the slowest in over a decade.
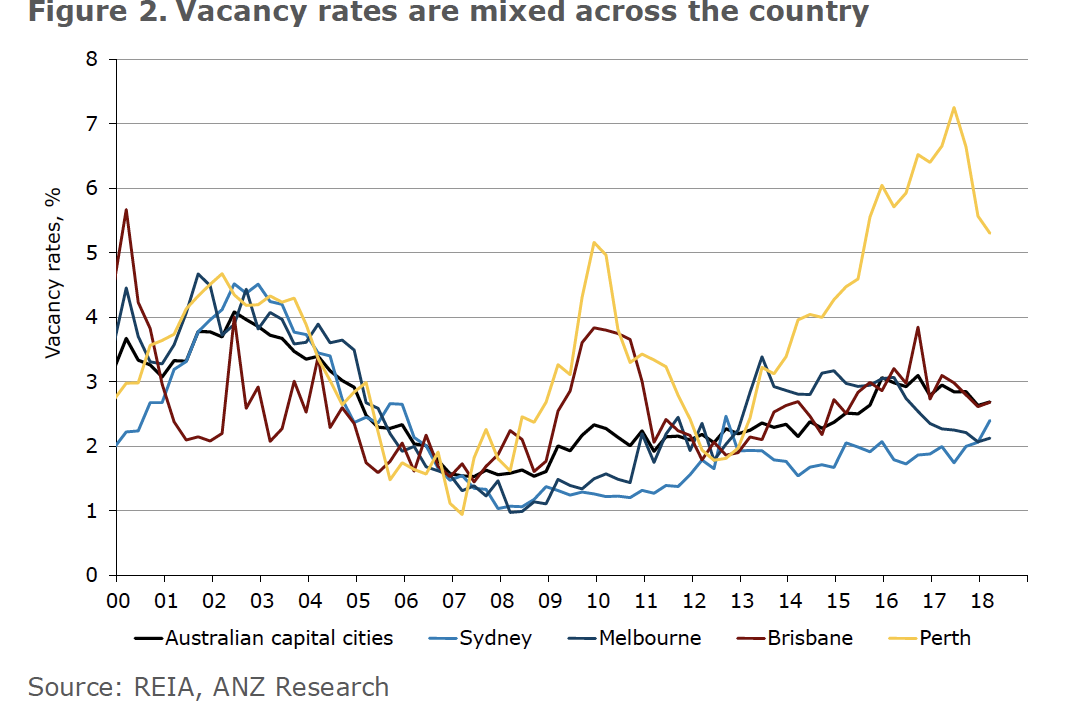
The weakness in Sydney is consistent with vacancy rates which have been trending higher for several years now.
It seems likely that this process has further to run given the strong pipeline of new supply set to enter the market.
There are currently nearly 90,000 dwellings under construction in New South Wales, and 66,000 apartments.
This backlog is nearly triple the size of the average backlog over the decade to 2012.
At the current rate of construction, that will take nearly two years to complete. 
Given the investor-led nature of the latest housing construction boom, it seems likely that the large additions to supply will keep putting upward pressure on vacancy rates and downward pressure on rents in the Sydney market.
The opposite is true in Hobart, where a very strong housing sector is also reflected in the rental market.
Rents rose another 0.8% q/q, and are now up 8% over the past two years.
This is again in line with the vacancy rate, which has collapsed to around 1% – the equal lowest for any state or territory on record.
In dollar terms, Residex data suggest that rental costs in Hobart are now only marginally below those in Melbourne, despite Victorian incomes being significantly higher.
In turn, this means that the share of income needed to pay rent is mixed across the country.
As we have previously noted, housing affordability is about more than just housing prices; rental affordability is an important part of the equation given that approximately one third of households are renters. 
Nationwide, just under 20% of an average household income is now spent on rent, which is the lowest share since 2012.
Sydney rent still requires the largest share of income, at around 23%, although this is down from nearly 26% in 2015.
Given the above dynamics, we see Hobart rental affordability has been steadily worsening in recent years and is now sitting at record levels (Figure 3).
On the other hand, affordability continues to improve across Darwin and Perth, as costs retreat from the mining boom peak.
We have observed that consumer confidence has been holding up well despite the decline in housing prices and the implied fall in household wealth.
Given that a large number of people rent, it is likely that a more affordable rental market is providing at least some support to household sentiment.
Further, for many potential first home buyers the current correction in housing prices is viewed as a positive.

Source of data and commentary: ANZ Research

Read more: propertyupdate.com.au