

Australia’s housing markets built momentum through the end of 2020, pointing to a strong start to 2021.
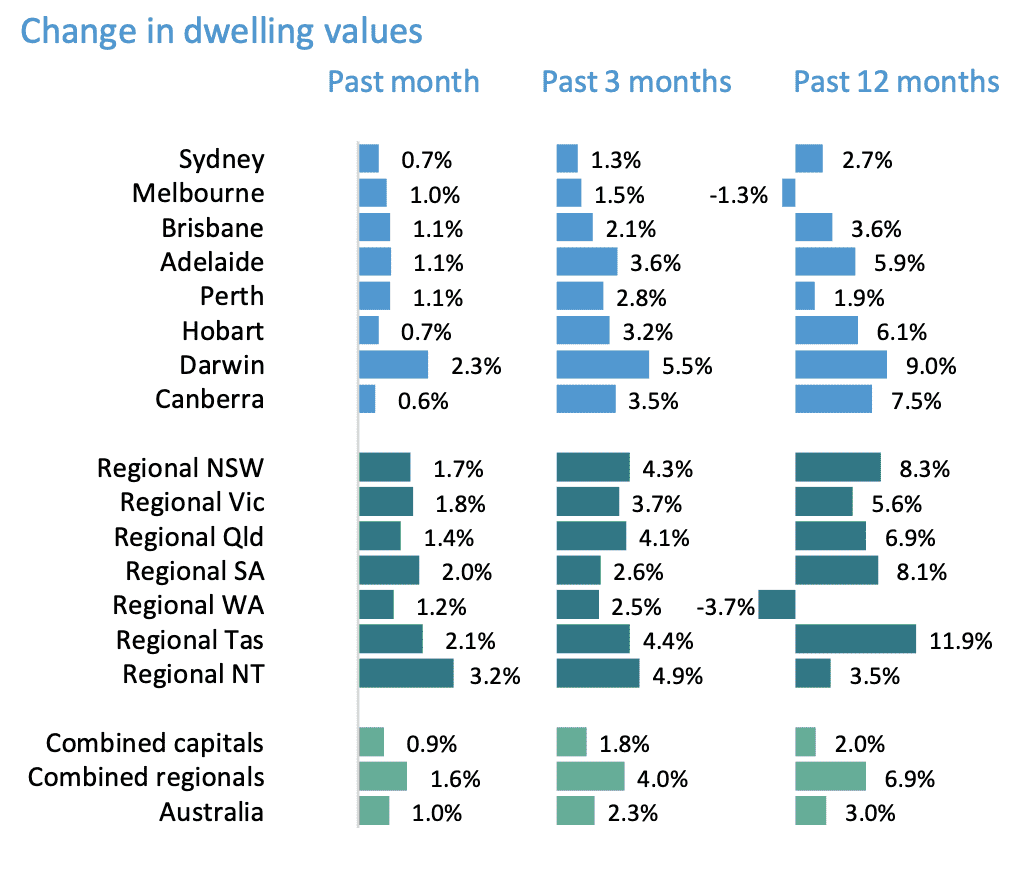
Australia’s property market finished the year on a strong footing with CoreLogic’s national home value index rising a further 1.0% in December; the third consecutive month-on-month rise following a -2.1% drop in dwelling values between April and September.
Australian home values finished the year 3.0% higher with regional housing values rising by 6.9%, a rate of capital gain that was more than three times higher than the combined capitals, where home values were up 2.0% over the year.
The year was characterised by a mild COVID dip in values, but unprecedented volatility in the transaction space.
The number of residential property sales plummeted by -40% through March and April but finished the year with almost 8% more sales relative to a year ago as buyer numbers surged through the second half of the year.
Despite the volatility, housing values showed remarkable resilience, falling by only -2.1% before rebounding with strength throughout the final quarter of 2020.

These results are unsurprising
In retrospect, the rebound in housing market activity and dwelling values is unsurprising given the rapid and substantial monetary and fiscal response from the Government and policy makers.
Record low interest rates played a key role in supporting housing market activity, along with a spectacular rise in consumer confidence as COVID-related restrictions were lifted and forecasts for economic conditions turned out to be overly pessimistic.
Containing the spread of the virus has been critical to Australia’s economic and housing market resilience.

Regional markets performed strongly
As remote working opportunities became more prevalent and demand for lifestyle properties and lower density housing options became more popular, regional areas of Australia saw housing market conditions surge.
Regional housing markets had generally underperformed relative to the capital city regions over the past decade, but 2020 saw regional housing values surge as demand outweighed supply.
On the flipside, higher density housing has generally underperformed throughout the year, with capital city unit values holding reasonably firm (+0.2%) while house values were up 2.6%.
Excluding Melbourne, every capital city recorded a higher rate of capital gain for houses relative to units in 2020.
The stronger growth conditions for houses over units is due to a range of factors.
Unit markets have historically been more popular amongst investor buyers; demand from investors has been weighed down by weak rental conditions across the unit sector along with high supply levels in some precincts.
A transition of demand towards lower density housing options has helped to buoy house values.
Although housing markets are gathering pace, four of the eight capitals are still recording dwelling values lower relative to their previous peaks.
Melbourne home values are still -4.1% below their March 2020 peak and Sydney dwelling values need to recover a further 3.9% before surpassing the previous July 2017 peak.
Perth and Darwin values remain -19.9% and -25.7% below their 2014 peaks.
Low inventory levels have been a feature of the Australian housing market through 2020.
Although the number of new listings surged higher through spring and early summer, the total number of residential dwellings advertised for sale has remained persistently low throughout 2020.
Total listings peaked at the end of November with approximately 165,000 properties available for sale, -18% lower relative to the same period in 2019, and -22% below the five year average for that time of the year.
At the end of 2020 there was -21% fewer properties available for sale than at the end of 2019.
Low advertised stock levels reflect a rapid rate of absorption; put simply there are more active buyers than new listings being added to the market.
Despite new listing numbers being consistently lower relative to their 2019 levels, the estimated number of home sales were almost 8% higher though 2020 compared with the 2019 calendar year.
This imbalance between effective supply and demand is another factor that has supported a rise in housing prices as a sense of urgency returned to the market. With home buyers outnumbering sellers, most areas around the country represent a seller’s market.


Auction clearance rates finished the year strongly
Strong selling conditions are also reflected in auction clearance rates which have held firm around the 70% mark since the first week of November.
Auction conditions have shown extreme volatility through 2020, with a large portion of auctions withdrawn from sale during periods of lockdown when onsite auctions and home inspections were banned.
As housing market conditions firm, homes are selling faster and vendors are discounting their prices less.
Across the combined capital cities, the median number of days on market has reduced from a recent high of 43 days over the three months ending July to 33 days throughout the December quarter.
Similarly, vendors are discounting their asking prices by a smaller amount, with the median vendor discount reducing from 3.6% to 2.8%.

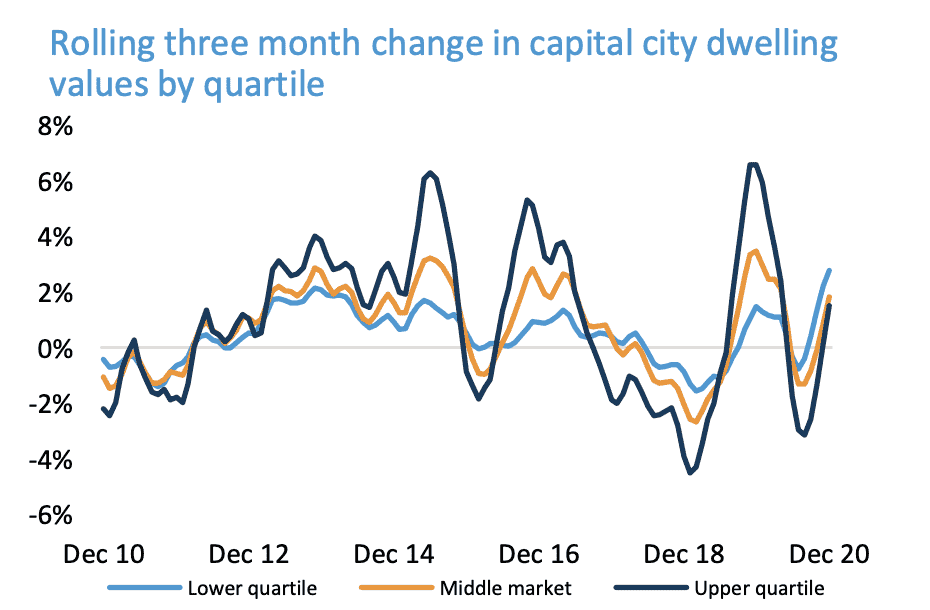
Performance across broad valuation cohorts
The most affordable quartile of the market is continuing to drive the strongest rise in values, however the performance gap is narrowing relative to more expensive properties.
Across the combined capitals, lower quartile home values were up 1.0% over the month compared with a 0.9% rise across the broad middle of the market and a 0.8% gain across the upper quartile of the market.
In Melbourne, where the upper quartile lost the most value through COVID, home values are now rebounding the fastest.
Melbourne’s upper quartile index increased in value by 0.98% in December, compared with a 0.97% rise across the lower quartile.
Sydney’s upper quartile is also bouncing back strongly, recording a 0.70% rise in values over the month compared with a 0.63% rise across the lower quartile.
Brisbane is also showing strength across the upper quartile, with dwelling values up 1.25% in December compared with a 0.94% rise in values across the lower quartile of the market.
Previous cycles have shown a similar trend, where the more expensive end of the market has shown both stronger gains through the upswing and larger declines through the down phase of the cycle.
With housing markets once again gaining momentum, it is likely the top end of the market will again start to outperform relative to other sectors.
The rental markets
Rental conditions have diverged substantially in 2020 from both a geographical perspective and across the housing types.
From a geographical perspective, the annual change in rents has been strong in Perth and Darwin where house rents are up around 10% in both cities and unit rents are 6.8% higher in Perth and 7.6% higher in Darwin.
The strength in Perth and Darwin rentals to both strong demand and a recent history of minimal supply additions.
Both Perth and Darwin have recorded below average levels of investor activity since housing market conditions started to cool in mid-2014 which has led to a shortage of rental stock.
More recently, with stronger interstate migration driving housing demand, rental rates have been under substantial upwards pressure as demand for rentals outweighs supply.”
Although rents are surging higher in Perth and Darwin, the longer term trend highlights the weak rental conditions that persisted prior to the recent upswing.

Perth rents remain -10.4% lower than the previous peak in May 2013 and Darwin rents remain almost -20% below their 2014 peak.
At the opposite end of the spectrum are rental conditions across the Melbourne and Sydney unit markets where weak demand and high supply has driven a sharp drop in rents.
Demand for inner city unit rentals has been significantly impacted by stalled overseas migration, especially from lower overseas student numbers.
Weak demand for inner city unit rentals has been exacerbated by a recent history of high rise apartment construction in Melbourne and Sydney, with the pipeline of new units that are still under construction remaining well above the decade average.
Melbourne unit rents are down -7.6% over the calendar year and Sydney unit rents are down -5.7%.
Weak rental conditions across the unit sector are likely to persist until overseas migration starts to ramp up and the higher levels of supply are absorbed.
Rental yields have been under some mild downwards pressure through the COVID period, with the gross yield across the combined capitals region reducing from 3.51% at the end of 2019 to 3.42% in December 2020, while yields across the combined regional areas have reduced from 5.03% last year to 4.83% this year.
Despite the lower yield profile, with interest rates likely to remain at record lows for some time yet, the opportunity for positive cash flow properties is becoming more prevalent.
Opportunities for positive cash flow properties along with the potential for capital gains is likely to see investment activity consistently lift through 2021.

In summary, 2020 has been a year of extremes for Australian housing markets.
Despite the volatility, home values have been resilient to material falls through the worst of the COVID-related economic downturn and the final quarter of 2020 has seen housing markets around the country stage a broad-based rise in values amidst strong demand and low advertised supply.
Housing market activity, which provides a multiplier effect for the Australian economy more broadly, ended the year with annual home sales about 8% higher than a year ago.
More home sales implies more work for a range of industries including real estate professionals, removalists, conveyancers, financiers and building inspectors along with more spending on household goods such as home furnishings, white goods and appliances.
The risks related to less fiscal support and the expiry of mortgage repayment deferrals have diminished as the economy outperforms forecasts and labour markets recover lost jobs.
Indeed, the mid-year economic and fiscal outlook estimates that around 600,000 fewer workers would need JobKeeper through December than originally expected and unemployment looks set to peak lower than the original budget estimates at 7.5%.
According to APRA, home loan deferrals dropped to $68.2Bn or 3.9% of the loan book in October, down from $195Bn (11%) in June.
As the March expiry of mortgage repayment holidays approaches it’s looking less likely that there will be a significant rise in distressed homes coming onto the market.
Although the trajectory for housing markets is looking positive as we move into 2021, the downside risks remain clear and present.
As demonstrated by Melbourne’s second round of lockdowns, new restrictions associated with a COVID outbreak would set back the economic recovery and have a negative, although temporary impact on housing markets.
Closed international borders are another wildcard; the longer borders remain closed the greater the impact is on housing demand, especially rental demand.
Regions where overseas migration has historically comprised a larger portion of overall population growth, such as Melbourne and Sydney, will be impacted the most by prolonged border closures.
Read more: propertyupdate.com.au