

window.googletag = window.googletag || {cmd: []};
googletag.cmd.push(function() {
googletag.defineSlot(‘/21854739906/PUAds’, [320, 480], ‘div-gpt-ad-1591951428937-0’).addService(googletag.pubads());
googletag.defineSlot(‘/21854739906/scnativead’, [‘fluid’], ‘div-gpt-ad-1606480494583-0’).addService(googletag.pubads());
googletag.defineSlot(‘/21854739906/SCNativebot’, [‘fluid’], ‘div-gpt-ad-1607089901157-0’).addService(googletag.pubads());
googletag.defineSlot(‘/21854739906/SentDiff’, [[320, 480], [580, 400]], ‘div-gpt-ad-1592314976732-0’).addService(googletag.pubads());
googletag.defineSlot(‘/21854739906/WealthRetreatM’, [300, 250], ‘div-gpt-ad-1614694819642-0’).addService(googletag.pubads());
googletag.defineSlot(‘/21854739906/WelthRetreatAndrewM’, [300, 250], ‘div-gpt-ad-1614692082542-0’).addService(googletag.pubads());
googletag.defineSlot(‘/21854739906/WRKen’, [300, 250], ‘div-gpt-ad-1591952574147-0’).addService(googletag.pubads());
googletag.defineSlot(‘/21854739906/WRMichael’, [300, 250], ‘div-gpt-ad-1614692298007-0’).addService(googletag.pubads());
googletag.defineSlot(‘/21854739906/WRPete’, [300, 250], ‘div-gpt-ad-1614692396886-0’).addService(googletag.pubads());
googletag.defineSlot(‘/21854739906/WRTom’, [300, 250], ‘div-gpt-ad-1614692503260-0’).addService(googletag.pubads());
googletag.defineSlot(‘/21854739906/WRDiff’, [[300, 250], [580, 400]], ‘div-gpt-ad-1614691717334-0’).addService(googletag.pubads());
googletag.defineSlot(‘/21854739906/WADiff’, [[300, 250], [580, 400]], ‘div-gpt-ad-1591954226942-0’).addService(googletag.pubads());
googletag.defineSlot(‘/21854739906/WAAll’, [300, 250], ‘div-gpt-ad-1591954430768-0’).addService(googletag.pubads());
googletag.defineSlot(‘/21854739906/PMDiff’, [[320, 480], [580, 400]], ‘div-gpt-ad-1591955248601-0’).addService(googletag.pubads());
googletag.defineSlot(‘/21854739906/PMAll’, [320, 480], ‘div-gpt-ad-1591955561642-0’).addService(googletag.pubads());
googletag.defineSlot(‘/21854739906/BYHAll’, [320, 480], ‘div-gpt-ad-1591955823345-0’).addService(googletag.pubads());
googletag.defineSlot(‘/21854739906/BYHDiff’, [[320, 480], [580, 400]], ‘div-gpt-ad-1591956110394-0’).addService(googletag.pubads());
googletag.defineSlot(‘/21854739906/MPAll’, [300, 250], ‘div-gpt-ad-1591961806038-0’).addService(googletag.pubads());
googletag.defineSlot(‘/21854739906/MPDiff’, [[300, 250], [580, 400]], ‘div-gpt-ad-1591962148719-0’).addService(googletag.pubads());
googletag.defineSlot(‘/21854739906/MMAll’, [300, 250], ‘div-gpt-ad-1591962591418-0’).addService(googletag.pubads());
googletag.defineSlot(‘/21854739906/MMDiff’, [[300, 250], [580, 400]], ‘div-gpt-ad-1591962513851-0’).addService(googletag.pubads());
googletag.defineSlot(‘/21854739906/MelbDiff’, [[320, 480], [580, 400]], ‘div-gpt-ad-1591963125912-0’).addService(googletag.pubads());
googletag.defineSlot(‘/21854739906/MelbAll’, [320, 480], ‘div-gpt-ad-1591962859656-0’).addService(googletag.pubads());
googletag.defineSlot(‘/21854739906/BrisbDiff’, [[320, 480], [580, 400]], ‘div-gpt-ad-1591963608964-0’).addService(googletag.pubads());
googletag.defineSlot(‘/21854739906/BrisbAll’, [320, 480], ‘div-gpt-ad-1591963452542-0’).addService(googletag.pubads());
googletag.defineSlot(‘/21854739906/SydDiff’, [[320, 480], [580, 400]], ‘div-gpt-ad-1591964270831-0’).addService(googletag.pubads());
googletag.defineSlot(‘/21854739906/SydAll’, [320, 480], ‘div-gpt-ad-1591963993486-0’).addService(googletag.pubads());
googletag.defineSlot(‘/21854739906/PDAll’, [320, 480], ‘div-gpt-ad-1591965401096-0’).addService(googletag.pubads());
googletag.defineSlot(‘/21854739906/PDDiff’, [[320, 480], [580, 400]], ‘div-gpt-ad-1591965559837-0’).addService(googletag.pubads());
googletag.defineSlot(‘/21854739906/RHPHDiff’, [[320, 480], [580, 400]], ‘div-gpt-ad-1591966343056-0’).addService(googletag.pubads());
googletag.defineSlot(‘/21854739906/RHPHAll’, [320, 480], ‘div-gpt-ad-1591966099982-0’).addService(googletag.pubads());
googletag.defineSlot(‘/21854739906/BooksAll’, [[300, 250], [320, 480]], ‘div-gpt-ad-1591967275697-0’).addService(googletag.pubads());
googletag.defineSlot(‘/21854739906/BookingDiff’, [[580, 400], [320, 480]], ‘div-gpt-ad-1592478409212-0’).addService(googletag.pubads());
googletag.defineSlot(‘/21854739906/MMDPPAll’, [320, 480], ‘div-gpt-ad-1599568850982-0’).addService(googletag.pubads());
googletag.defineSlot(‘/21854739906/MMDPPDiff’, [[320, 480], [580, 400]], ‘div-gpt-ad-1599568940250-0’).addService(googletag.pubads());
googletag.defineSlot(‘/21854739906/NIPAll’, [320, 480], ‘div-gpt-ad-1599569002292-0’).addService(googletag.pubads());
googletag.defineSlot(‘/21854739906/NIPDiff’, [[580, 400], [320, 480]], ‘div-gpt-ad-1599572187548-0’).addService(googletag.pubads());
googletag.defineSlot(‘/21854739906/Andmirams’, [300, 250], ‘div-gpt-ad-1612269270436-0’).addService(googletag.pubads());
googletag.defineSlot(‘/21854739906/MarkCreedon’, [300, 250], ‘div-gpt-ad-1612269503026-0’).addService(googletag.pubads());
googletag.defineSlot(‘/21854739906/kuest’, [300, 250], ‘div-gpt-ad-1615181511684-0’).addService(googletag.pubads());
googletag.defineSlot(‘/21854739906/smsfguideall’, [320, 480], ‘div-gpt-ad-1637328406384-0’).addService(googletag.pubads());
googletag.defineSlot(‘/21854739906/structuresandtrusts’, [320, 480], ‘div-gpt-ad-1637328815586-0’).addService(googletag.pubads());
googletag.defineSlot(‘/21854739906/timingthe’, [320, 480], ‘div-gpt-ad-1637585072120-0’).addService(googletag.pubads());
//googletag.pubads().enableSingleRequest();
googletag.pubads().collapseEmptyDivs();
googletag.enableServices();
});
Housing values continued to rise last month, but conditions are diversifying as stock levels rise and affordability pressures mount.
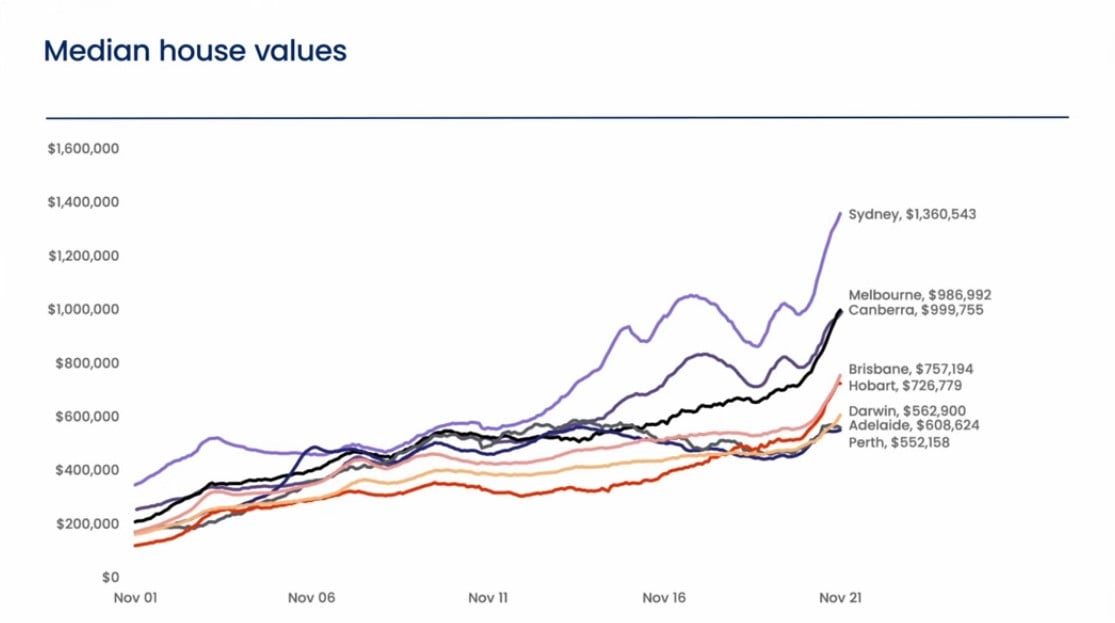
Australian housing values were 1.3% higher in November marking the 14th consecutive month where CoreLogic’s national home value index recorded positive value growth.
The November update takes national housing values 22.2% higher over the past 12 months, adding approximately $126,700 to the median value of an Australian home.
Although values are continuing to rise, the November result was the softest outcome since January when values rose 0.9%.

Since a cyclical peak in the rate of growth back in March, when housing values rose at 2.8%, there has been a notable trend towards milder price growth.
Virtually every factor that has driven housing values higher has lost some potency over recent months.
googletag.cmd.push(function() { googletag.display(‘div-gpt-ad-1637585072120-0’); });
Fixed mortgage rates are rising, higher listings are taking some urgency away from buyers, affordability has become a more substantial barrier to entry and credit is less available.
Brisbane and Adelaide are the only capital cities yet to experience a slowdown, with the monthly rate of growth reaching a new cyclical high across both cities in November.
Brisbane home values were up 2.9% in November while Adelaide values were up 2.5%.
In dollar terms that equates to a monthly rise of approximately $18,500 and $13,500 respectively based on median values.
Relative to the larger cities, housing affordability is less pressing, there have been fewer disruptions from COVID lockdowns and a positive rate of interstate migration is fueling housing demand.

On the other hand, Sydney and Melbourne have seen demand more heavily impacted by affordability pressures and negative migration from both interstate and an overseas perspective.
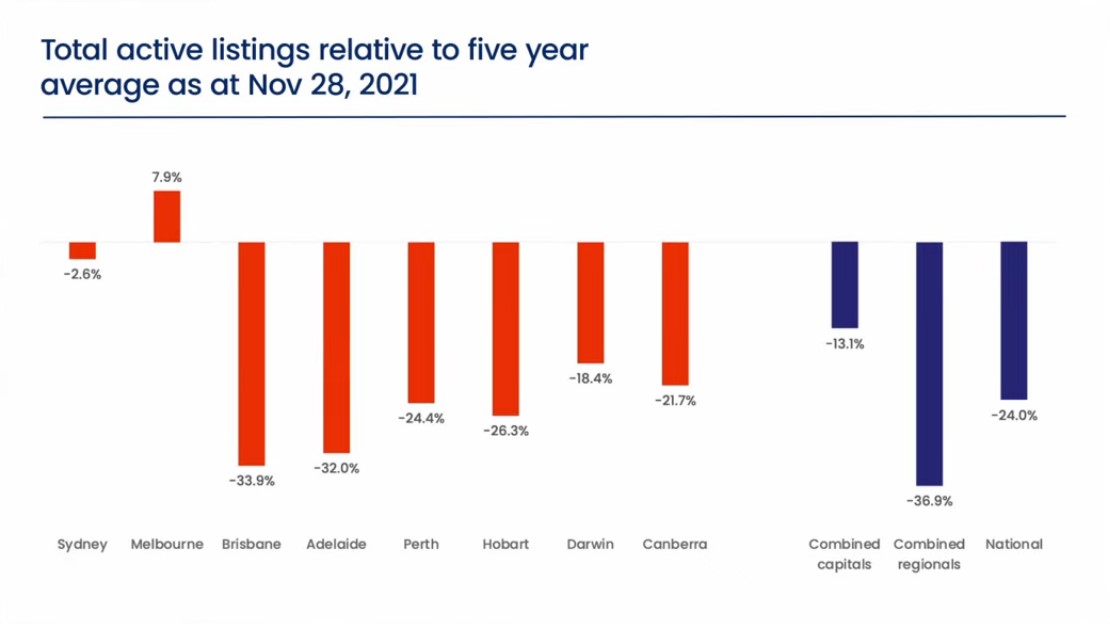
Different supply dynamics are also creating divergent trends across Australia’s capital cities.
In the four-week period to November 28, total advertised stock levels across Adelaide were -32% lower than the five-year average, and -34% lower across Brisbane.
Across Sydney and Melbourne however, stock levels have become far more normalised in recent weeks, with Sydney’s total listing numbers sitting -3% below the five-year average, while stock levels across Melbourne are 8% above the five-year average.

As listings rise we are also seeing a subtle softening in vendor metrics such as the median number of days it takes to sell a property and auction clearance rates.
Capital city homes are showing a median time on the market of 25 days, up compared with a recent low of just 21 days in May.
At the same time, auction clearance rates have trended lower, with the capital city weighted average reducing from the low 80% range in early October to the high 60% range over the last week of November.
The rise in listings and softening of key vendor metrics implies the housing market may be moving through a peak in selling conditions, however, it will be important to see if continues after the festive season.
Another trend that is evolving is that houses are no long outperforming units as substantially as they were earlier this year.
Houses continued to record a higher growth rate than units, however, the quarterly rate of growth is now the narrowest it has been since October last year, with 1.6 percentage points between the two broad housing types.
Based on median values, capital city houses are now 38% more expensive than capital city units — that’s the largest difference on record.
In dollar value terms, a capital city house is averaging approximately $240,000 more than a capital city unit.

In Sydney, where the gap between house and unit values is the widest, a house now costs $523,000 more on average than a unit.
With such a large value gap opening up between the broad housing types, it’s no wonder we are seeing demand gradually transition towards higher density housing options, simply because they are substantially more affordable than buying a house.

The slowdown in housing market conditions is less obvious across the regional areas of Australia, where the monthly pace of capital gains has accelerated over the past three months.
Across the combined ‘rest-of-state’ regions of Australia, housing values were up 2.2% in November, double the monthly rate recorded over the combined capital cities at 1.1%.

Regional Tasmania and regional New South Wales have been the standouts from a capital growth perspective.
Across regional Australia, the strongest growth trends remain skewed towards the coastal and the lifestyle markets with NSW’s Southern Highlands and Shoalhaven recording the highest quarterly growth rate at 9.7% followed by the Hunter Valley at 8.9% and Tasmania’s Launceston and North East region at 7.7%.

Demand for housing across regional markets, especially those within commuting distance of the major cities, is continuing to benefit from the rise in popularity of remote working arrangements, along with the renewed demand for coastal and lifestyle properties, and in many cases, more affordable housing options.

ALSO READ: 8 Property trends we can expect in 2022
googletag.cmd.push(function() { googletag.display(‘div-gpt-ad-1592314976732-0’); });
Read more: propertyupdate.com.au